United Maritime Reports First Quarter 2025 Financial Results and Declares Quarterly Cash Dividend of $0.01 Per Share
| Highlights | |||
| (in million USD, except LPS) | Q1 2025 | Q1 2024 | |
| Net Revenues | $7.8 | $10.6 | |
| Net Loss | ($4.5) | ($1.3) | |
| Adjusted Net Loss1 | ($4.4) | ($1.1) | |
| EBITDA1 | $0.7 | $3.5 | |
| Adjusted EBITDA1 | $0.9 | $3.7 | |
| Loss per share Basic and Diluted | ($0.52) | ($0.15) | |
| Adjusted loss per share Basic1 and Diluted1 | ($0.50) | ($0.13) | |
Other Highlights and Developments:
- Consistent Shareholder Returns: Declared a quarterly cash dividend of $0.01 per share for Q1 2025, marking the tenth consecutive quarterly distribution. Since initiating its capital return program in November 2022, United has declared total cash dividends of $1.62 per share, or $12.9 million in aggregate distributions.
- Strategic Diversification Through Offshore Investment: Increased our equity stake in the newbuilding Energy Construction Vessel (“ECV”) joint venture, advancing our broader strategy to diversify earnings and risk exposure. This investment enhances our positioning in a sector supported by rising asset values and favorable market dynamics.
_________________________________
1 Adjusted loss per share, Adjusted Net loss, EBITDA and Adjusted EBITDA are non-GAAP measures. Please see the reconciliation below of Adjusted loss per share, Adjusted Net loss, EBITDA and Adjusted EBITDA to net loss, the most directly comparable U.S. GAAP measure.
GLYFADA, Greece, May 22, 2025 (GLOBE NEWSWIRE) -- United Maritime Corporation (“United” or the “Company”) (NASDAQ: USEA), announced today its financial results for the first quarter ended March 31, 2025. The Company also declared a quarterly dividend of $0.01 per common share for the first quarter of 2025.
For the quarter ended March 31, 2025, the Company generated Net Revenues of $7.8 million compared to $10.6 million in the first quarter of 2024. Adjusted EBITDA for the quarter was $0.9 million, compared to $3.7 million for the same period of 2024. Net Loss and Adjusted Net Loss for the quarter were $4.5 million and $4.4 million, respectively, compared to Net Loss and Adjusted Net Loss of $1.3 million and $1.1 million in the first quarter of 2024. The Time Charter Equivalent (“TCE”) rate of the fleet for the first quarter of 2025 was $9,953 per day, compared to $15,165 in the same period of 2024.
Cash and cash-equivalents and restricted cash as of March 31, 2025, stood at $3.4 million. Shareholders’ equity at the end of the first quarter was $55.6 million, while long-term debt, finance lease liabilities and other financial liabilities, net of deferred finance costs stood at $94.5 million as of March 31, 2025. The book value of our fleet as of March 31, 2025, stood at $151.3 million, including one chartered-in Kamsarmax vessel and one Capesize vessel held for sale.
Stamatis Tsantanis, the Company’s Chairman & Chief Executive Officer, stated:
“For the first quarter of 2025 United reported Net Revenue of $7.8 million and EBITDA of $0.7 million, based on a daily time charter equivalent of $9,953. While our financial performance was adversely impacted by the seasonally weak conditions in the dry bulk market, we remain encouraged by the positive medium and long-term outlook for the sector. Despite the softer quarter, our board of directors has approved a dividend of $0.01 for the first quarter, our tenth consecutive quarterly dividend. Since November 2022, we have returned $1.62 per share in total dividends to our shareholders, underscoring our commitment to delivering returns throughout the market cycle.
“Concerning our fleet developments, we anticipate concluding the sale of the M/V Gloriuship, our oldest vessel, within the second quarter of 2025. Until the time of her delivery, the M/V Gloriuship remains employed on a voyage basis at a daily rate above current market levels. The M/Vs Goodship and Nisea are also fixed at above market rates, providing more visibility and earnings stability into the next quarters.
“Regarding our guidance, we have already secured approximately 79% of our second quarter days at a healthy average rate of $16,835, while we expect the daily TCE for the full quarter to be approximately $15,653, based on current FFA values. Overall, four vessels, including the M/V Gloriuship, are currently employed on fixed daily rates, with the remaining four subject to prevailing market conditions. This sharp rebound from Q1 reflects both a market recovery and the effectiveness of our proactive freight hedging strategy through index-linked charter conversions.
“We are also particularly pleased to have increased our equity stake in the Energy Construction Vessel (“ECV”) joint venture to approximately 30%. This represents a key milestone in our broader strategy to diversify our earnings base beyond dry bulk. The ECV project is uniquely positioned to benefit from rising demand in both traditional offshore energy and renewables, at a time when supply remains constrained. We view this as a forward-looking investment with the potential to unlock long-term value.
“Regarding the dry bulk market performance, the first quarter of 2025 was impacted by a seasonal slowdown in coal and iron ore trade, consistent with the typical cyclical patterns that follow elevated export volumes recorded in 2024. Since March, we have observed a degree of normalization, with daily charter rates recovering meaningfully. However, near-term conditions remain relatively soft, pending a more sustained recovery in trade volumes and impacted by a backdrop of cautious economic sentiment and heightened market volatility, introduced by the recent trade policy uncertainties. Encouragingly, recent developments suggest a narrowing of the scope for additional tariffs and trade restrictions, though risks of more adverse outcomes cannot yet be fully discounted. From a longer-term perspective, dry bulk market fundamentals remain constructive, underpinned by limited fleet growth and continued demand for key commodities across grains, power generation, manufacturing, and construction.
“While the near-term environment remains dynamic, we believe United is well-positioned to benefit from improving fundamentals. With a balanced capital structure, strategic optionality across our fleet, and a targeted expansion into offshore markets, we remain confident in our ability to deliver sustainable growth and compelling returns to our shareholders.”
Current Company Fleet:
| Vessel Name | Sector | Capacity (DWT) | Year Built | Yard | Employment Type | Minimum T/C expiration | Maximum T/C expiration(1) |
| Goodship | Dry Bulk / Capesize | 177,536 | 2005 | Mitsui | T/C Index Linked(2) | Oct-25 | Dec-25 |
| Tradership | Dry Bulk / Capesize | 176,925 | 2006 | Namura | T/C Index Linked(2) | Jan-25 | Jun-25 |
| Gloriuship(3) | Dry Bulk / Capesize | 171,314 | 2004 | Hyundai | Spot Employment | N/A | N/A |
| Nisea(4) | Dry Bulk / Kamsarmax | 82,235 | 2016 | Oshima | T/C Fixed Rate | Jul-25 | Sep-25 |
| Cretansea | Dry Bulk / Kamsarmax | 81,508 | 2009 | Universal | T/C Index Linked(2) | Sep-25 | Dec-25 |
| Chrisea | Dry Bulk / Panamax | 78,173 | 2013 | Shin Kurushima | T/C Index Linked(2) | Mar-27 | Jul-27 |
| Synthesea | Dry Bulk / Panamax | 78,020 | 2015 | Sasebo | T/C Index Linked(2) | Aug-25 | Dec-25 |
| Exelixsea | Dry Bulk / Panamax | 76,361 | 2011 | Oshima | T/C Index Linked(2) | Jun-25 | Oct-25 |
| Total/Average age | 922,072 | 15.1 years |
| (1) | The latest redelivery dates do not include any additional optional periods. | |
| (2) | “T/C” refers to a time charter agreement. Under these index-linked T/Cs, the Company has the option to convert the index-linked rate to fixed for a period of minimum two months, based on the prevailing FFA Rates for the selected period, and has done so for certain vessels as part of its freight hedging strategy, as described below under “Second Quarter 2025 TCE Rate Guidance”. | |
| (3) | The vessel is expected to be delivered to her new owners in June 2025. | |
| (4) | The vessel is technically and commercially operated by the Company on the basis of an 18-month bareboat charter-in contract with the owners of the vessel, including a purchase option at the end of the bareboat charter in favour of the Company. | |
Fleet Data:
| Q1 2025 | Q1 2024 | |||
| Ownership days (1) | 720 | 728 | ||
| Operating days (2) | 678 | 659 | ||
| Fleet utilization (3) | 94.2% | 90.5% | ||
| TCE rate (4) | $9,953 | $15,165 | ||
| Daily Vessel Operating Expenses (5) | $6,489 | $7,085 |
| (1) | Ownership days are the total number of calendar days in a period during which the vessels in a fleet have been owned or chartered. Ownership days are an indicator of the size of the Company’s fleet over a period and affect both the amount of revenues and the amount of expenses that the Company recorded during a period. | |
| (2) | Operating days are the number of available days in a period less the aggregate number of days that the vessels are off-hire due to unforeseen circumstances. Available days are the number of ownership days less the aggregate number of days that our vessels are off-hire due to major repairs, dry-dockings, lay-up or special or intermediate surveys. Operating days include the days that our vessels are on ballast voyages without having finalized agreements for their next employment. The Company’s calculation of operating days may not be comparable to that reported by other companies. | |
| (3) | Fleet utilization is the percentage of time that the vessels are generating revenue and is determined by dividing operating days by ownership days for the relevant period. | |
| (4) | TCE rate is defined as the Company’s net revenue less voyage expenses during a period divided by the number of the Company’s operating days during the period. Voyage expenses include port charges, bunker (fuel oil and diesel oil) expenses, canal charges and other commissions. The Company includes the TCE rate, a non-GAAP measure, as it believes it provides additional meaningful information in conjunction with net revenues from vessels, the most directly comparable U.S. GAAP measure, and because it assists the Company’s management in making decisions regarding the deployment and use of our vessels and because the Company believes that it provides useful information to investors regarding our financial performance. The Company’s calculation of TCE rate may not be comparable to that reported by other companies. The following table reconciles the Company’s net revenues from vessels to the TCE rate. | |
(In thousands of U.S. Dollars, except operating days and TCE rate)
| Q1 2025 | Q1 2024 | |||
| Vessel revenue, net | 7,754 | 10,598 | ||
| Less: Voyage expenses | 1,006 | 604 | ||
| Time charter equivalent revenues | 6,748 | 9,994 | ||
| Operating days | 678 | 659 | ||
| TCE rate | $9,953 | $15,165 |
| (5) | Vessel operating expenses include crew costs, provisions, deck and engine stores, lubricants, insurance, maintenance and repairs. Daily Vessel Operating Expenses are calculated by dividing vessel operating expenses, excluding pre-delivery costs of acquired vessels, if applicable, by ownership days for the relevant time periods. The Company’s calculation of daily vessel operating expenses may not be comparable to that reported by other companies. The following table reconciles the Company’s vessel operating expenses to daily vessel operating expenses. | |
(In thousands of U.S. Dollars, except ownership days and Daily Vessel Operating Expenses)
| Q1 2025 | Q1 2024 | |||
| Vessel operating expenses | 4,672 | 5,158 | ||
| Ownership days | 720 | 728 | ||
| Daily Vessel Operating Expenses | $6,489 | $7,085 | ||
Net Loss to EBITDA and Adjusted EBITDA Reconciliation:
(In thousands of U.S. Dollars)
| Q1 2025 | Q1 2024 | |||
| Net loss | (4,485 | ) | (1,340 | ) |
| Interest and finance costs, net | 1,911 | 2,031 | ||
| Depreciation and amortization | 3,315 | 2,810 | ||
| EBITDA | 741 | 3,501 | ||
| Stock based compensation | 104 | 190 | ||
| Loss on extinguishment of debt | - | 22 | ||
| Loss on equity method investment | 16 | - | ||
| Adjusted EBITDA | 861 | 3,713 |
Earnings Before Interest, Taxes, Depreciation and Amortization (“EBITDA”) represents the sum of net income, net interest and finance costs, depreciation and amortization and, if any, income taxes during a period. EBITDA is not a recognized measurement under U.S. GAAP. Adjusted EBITDA represents EBITDA adjusted to exclude stock-based compensation, loss on extinguishment of debt and loss on equity method investment, which the Company believes are not indicative of the ongoing performance of its core operations.
EBITDA and Adjusted EBITDA are presented as we believe that these measures are useful to investors as a widely used means of evaluating operating profitability. EBITDA and Adjusted EBITDA as presented here may not be comparable to similarly titled measures presented by other companies. These non-GAAP measures should not be considered in isolation from, as a substitute for, or superior to financial measures prepared in accordance with U.S. GAAP.
Net Loss and Adjusted Net Loss Reconciliation and calculation of Adjusted Loss Per Share
(In thousands of U.S. Dollars)
| Q1 2025 | Q1 2024 | |||
| Net loss | (4,485 | ) | (1,340 | ) |
| Stock based compensation | 104 | 190 | ||
| Loss on extinguishment of debt | - | 22 | ||
| Loss on equity method investment | 16 | - | ||
| Adjusted net loss | (4,365 | ) | (1,128 | ) |
| Adjusted net loss – common stockholders, basic and diluted | (4,365 | ) | (1,128 | ) |
| Adjusted loss per common share, basic and diluted | (0.50 | ) | (0.13 | ) |
| Weighted average number of common shares outstanding, basic and diluted | 8,686,073 | 8,688,498 |
To derive Adjusted Net loss and Adjusted Net loss Per Share, both non-GAAP measures, from Net loss, we exclude certain non-cash items, as provided in the table above. We believe that Adjusted Net loss and Adjusted Net loss Per Share assist our management and investors by increasing the comparability of our performance from period to period since each such measure eliminates the effects of such non-cash items as stock-based compensation, loss on extinguishment of debt, loss on equity method investment and other items which may vary from year to year, for reasons unrelated to overall operating performance. In addition, we believe that the presentation of the respective measures provides investors with supplemental data relating to our results of operations, and therefore, with a more complete understanding of factors affecting our business than with GAAP measures alone. Our method of computing Adjusted Net loss and Adjusted Net loss Per Share may not necessarily be comparable to other similarly titled captions of other companies due to differences in methods of calculation.
Second Quarter 2025 TCE Rate Guidance:
As of the date hereof, approximately 79% of the Company fleet’s expected operating days in the second quarter of 2025 have been fixed at an estimated TCE rate of approximately $16,835. Assuming that for the remaining operating days of our index-linked T/Cs, the respective vessels’ TCE rate will be equal to an average Forward Freight Agreement (“FFA”) rate of $18,000 for Capesize and $11,678 for Kamsarmax per day (based on the FFA curve of May 16, 2025), our estimated TCE for the second quarter of 2025 is approximately $15,6532. Our TCE rate guidance for the second quarter of 2025 includes the already performed conversions of index-linked charters to fixed for the period.
The following table provides the breakdown of index-linked charters and fixed-rate charters in the second quarter of 2025:
| Operating Days | TCE Rate | |
| TCE - fixed rate (index-linked conversions) | 182 | $16,679 |
| TCE - fixed rate | 176 | $21,584 |
| TCE – index-linked | 350 | $11,678 |
| Total / Average | 708 | $15,653 |
_______________________________
2 This guidance is based on certain assumptions and the Company cannot provide assurance that these TCE rate estimates or projected utilization rates will be realized. TCE estimates include certain floating (index) to fixed rate conversions concluded in previous periods. For vessels on index-linked T/Cs, the TCE rate realized will vary with the underlying index, and for the purposes of this guidance, the TCE rate assumed for the remaining operating days of the quarter for an index-linked T/C is equal to an average FFA rate of $18,000 for Capesize and $11,678 for Kamsarmax per day (based on the FFA curve of May 16, 2025). Spot estimates are provided using the load-to-discharge method of accounting. The rates quoted are for days currently contracted. Increased ballast days at the end of the quarter will reduce the additional revenues that can be booked based on the accounting cut-offs and therefore the resulting TCE rate will be reduced accordingly.
First Quarter and Recent Developments:
Dividend Distribution for Q4 2024 and Declaration of Q1 2025 Dividend
On April 10, 2025, the Company paid the previously announced quarterly dividend of $0.01 per common share, for the fourth quarter of 2024, to all shareholders of record as of March 27, 2025.
The Company also declared a cash dividend of $0.01 per common share for the first quarter of 2025 payable on or about July 10, 2025, to all shareholders of record as of June 30, 2025.
Commercial Updates
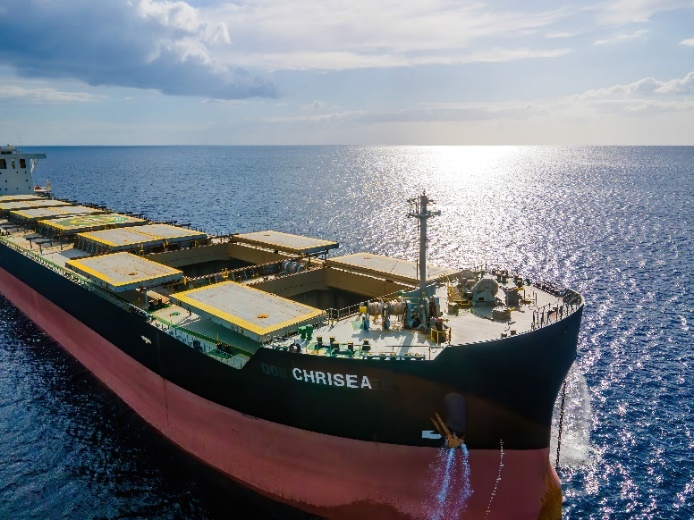
M/V Chrisea – Time charter extension
In April 2025, the charterer of the M/V Chrisea agreed to extend the time charter agreement in direct continuation from the previous agreement. The extension period will commence on September 23, 2025, for a duration of about 18 months to about 21 months. All main terms of the time charter remain materially the same.
Investing & Financing Updates
Offshore Sector
In April 2025, the Company increased its stake in a Norwegian-based company established to participate in the design and building of a technologically and environmentally advanced ECV. This expansion was facilitated through amendments to existing shareholders’ and subscription agreements. United had previously committed capital of up to $8.5 million, which has now been increased to approximately $10.0 million, representing an approximately 30% stake in the project.
The additional capital injection in the ECV project was financed by a $2.0 million short-term bridge loan facility provided by Seanergy Maritime Holdings Corp. which we expect to repay through the proceeds from the sale of the M/V Gloriuship. The facility bears interest at a rate of 10.0% per annum and is scheduled to mature on the earlier of (i) five business days following the delivery of the M/V Gloriuship to her new owners or (ii) July 15, 2025.
|
United Maritime Corporation Unaudited Condensed Consolidated Balance Sheets (In thousands of U.S. Dollars) | ||||||
| March 31, 2025 |
December 31, 2024* |
|||||
| ASSETS | ||||||
| Cash and cash equivalents and restricted cash | 3,392 | 6,762 | ||||
| Vessels, net, Right-of-use assets and Vessel held for sale | 151,329 | 153,029 | ||||
| Other assets | 14,656 | 12,282 | ||||
| TOTAL ASSETS | 169,377 | 172,073 | ||||
| LIABILITIES AND STOCKHOLDERS’ EQUITY | ||||||
| Long-term debt, finance lease liability and other financial liabilities, net of deferred finance costs | 94,480 | 97,723 | ||||
| Other liabilities | 19,274 | 14,262 | ||||
| Stockholders’ equity | 55,623 | 60,088 | ||||
| TOTAL LIABILITIES AND STOCKHOLDERS’ EQUITY | 169,377 | 172,073 | ||||
* Derived from the audited consolidated financial statements as of the period as of that date
|
United Maritime Corporation Unaudited Condensed Consolidated Statements of Operations (In thousands of U.S. Dollars, except for share and per share data) | ||||||
| Three months ended March 31, |
||||||
| 2025 | 2024 | |||||
| Vessel Revenue, net | 7,754 | 10,598 | ||||
| Expenses: | ||||||
| Voyage expenses | (1,006 | ) | (604 | ) | ||
| Vessel operating expenses | (4,672 | ) | (5,158 | ) | ||
| Management fees | (601 | ) | (592 | ) | ||
| General and administrative expenses | (640 | ) | (778 | ) | ||
| Depreciation and amortization | (3,315 | ) | (2,810 | ) | ||
| Operating (loss) / income | (2,480 | ) | 656 | |||
| Other income / (expenses): | ||||||
| Interest and finance costs | (1,929 | ) | (2,123 | ) | ||
| Interest income | 18 | 92 | ||||
| Loss on extinguishment of debt | - | (22 | ) | |||
| Loss on equity method investment | (16 | ) | - | |||
| Other, net | (78 | ) | 57 | |||
| Total other expenses, net: | (2,005 | ) | (1,996 | ) | ||
| Net loss | (4,485 | ) | (1,340 | ) | ||
| Net loss attributable to common stockholders | (4,485 | ) | (1,340 | ) | ||
| Net loss per common share, basic and diluted | (0.52 | ) | (0.15 | ) | ||
| Weighted average number of common shares outstanding, basic and diluted | 8,686,073 | 8,688,498 | ||||
|
United Maritime Corporation Unaudited Condensed Consolidated Cash Flow Data (In thousands of U.S. Dollars) | ||||||
| Three months ended March 31, |
||||||
| 2025 | 2024 | |||||
| Net cash provided by operating activities | 1,147 | 2,296 | ||||
| Net cash used in investing activities | (359 | ) | (3,750 | ) | ||
| Net cash used in financing activities | (4,158 | ) | (3,291 | ) | ||
About United Maritime Corporation
United Maritime Corporation is an international shipping company specializing in worldwide seaborne transportation services. The Company operates a fleet of eight dry bulk vessels, comprising three Capesize, two Kamsarmax and three Panamax vessels, with an aggregate cargo carrying capacity of 922,072 dwt. Upon the completion of the sale of the M/V Gloriuship, the Company’s operating fleet will consist of two Capesize, two Kamsarmax and three Panamax vessels, with an aggregate cargo carrying capacity of 750,758 dwt.
The Company is incorporated under the laws of the Republic of the Marshall Islands and has executive offices in Glyfada, Greece. The Company's common shares trade on the Nasdaq Capital Market under the symbol “USEA”.
Please visit the Company’s website at: www.unitedmaritime.gr.
Forward-Looking Statements
This press release contains forward-looking statements (as defined in Section 27A of the Securities Act of 1933, as amended, and Section 21E of the Securities Exchange Act of 1934, as amended) concerning future events, including with respect to the declaration of dividends, market trends and shareholder returns. Words such as “may”, “should”, “expects”, “intends”, “plans”, “believes”, “anticipates”, “hopes”, “estimates” and variations of such words and similar expressions are intended to identify forward-looking statements. These statements involve known and unknown risks and are based upon a number of assumptions and estimates, which are inherently subject to significant uncertainties and contingencies, many of which are beyond the control of the Company. Actual results may differ materially from those expressed or implied by such forward-looking statements. Factors that could cause actual results to differ materially include, but are not limited to, the Company’s operating or financial results; the Company’s liquidity, including its ability to service its indebtedness; competitive factors in the market in which the Company operates; shipping industry trends, including charter rates, vessel values and factors affecting vessel supply and demand; future, pending or recent acquisitions and dispositions, business strategy, impacts of litigation, areas of possible expansion or contraction, and expected capital spending or operating expenses; risks associated with operations outside the United States; broader market impacts arising from trade disputes or war (or threatened war) or international hostilities, such as between Israel and Hamas and related hostilities in the region and between Russia and Ukraine; risks associated with the length and severity of pandemics, including their effects on demand for dry bulk products and the transportation thereof; and other factors listed from time to time in the Company’s filings with the SEC, including its most recent annual report on Form 20-F. The Company’s filings can be obtained free of charge on the SEC’s website at www.sec.gov. Except to the extent required by law, the Company expressly disclaims any obligations or undertaking to release publicly any updates or revisions to any forward-looking statements contained herein to reflect any change in the Company’s expectations with respect thereto or any change in events, conditions or circumstances on which any statement is based.
For further information please contact:
United Investor Relations
Tel: +30 213 0181 522
E-mail: ir@usea.gr
Capital Link, Inc.
Paul Lampoutis
230 Park Avenue Suite 1540
New York, NY 10169
Tel: (212) 661-7566
E-mail: usea@capitallink.com
A photo accompanying this announcement is available at https://www.globenewswire.com/NewsRoom/AttachmentNg/10b1a32c-3db4-4268-8f88-0e6e511ca4a4


MV Chrisea
MV Chrisea
Legal Disclaimer:
EIN Presswire provides this news content "as is" without warranty of any kind. We do not accept any responsibility or liability for the accuracy, content, images, videos, licenses, completeness, legality, or reliability of the information contained in this article. If you have any complaints or copyright issues related to this article, kindly contact the author above.
